VIBRIS - PhD thesis
Seismic tomography of western France by ambient noise correlation, by Ianis Gaudot
Contact: ianis.gaudot@univ-nantes.fr (personal webpage)
Advisors : Antoine Mocquet, Éric Beucler, Mathieu Lefeuvre.
Defense planned at the end of 2015.
The seismic tomography is a tool allowing to explore the Earth's interior. My PhD project consists in imaging the geologic structures located between 0 and 100 km depth below the Massif Armoricain and the Golfe de Gascogne. The interpretation of these images will allow a better understanding of the geodynamic evolution of western France. The technique used is the surface wave tomography by noise correlation. The data are obtained by using the seismic noise created by the oceans and continuously recorded by an array of seismic stations (see Fig. 1). The seismic noise correlation recorded at two stations allows, in good conditions, the emergence of a consistent signal which its characteristics are directly linked to the properties of the media located between the two stations (see Fig. 2). The compilation of all the measures obtained between each pair of station leads, after an inversion process, to a seismic velocity model of the studied region interpretable in term of geologic structures.
Axis of research
-
emergence of noise correlation functions
-
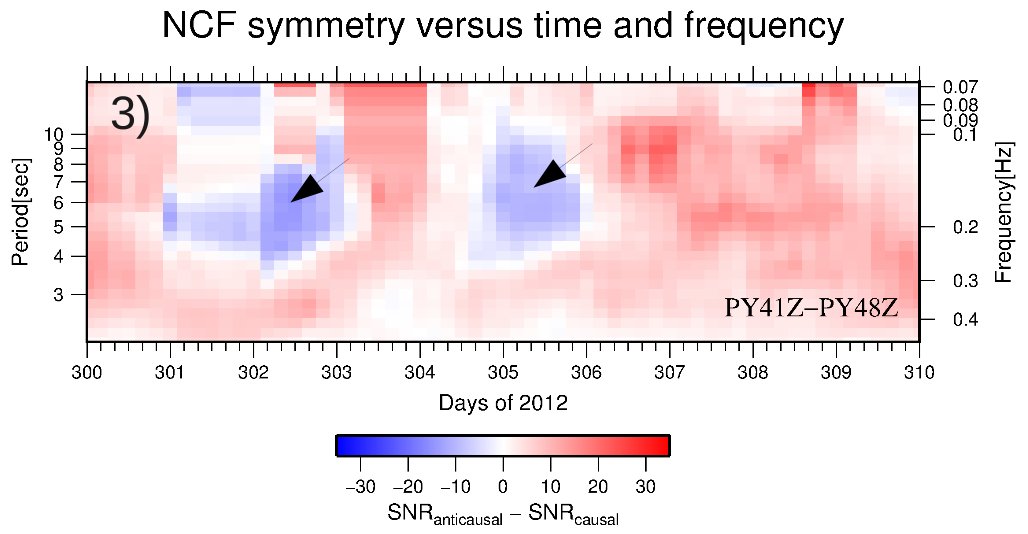
characterization of noise sources from noise correlation functions (see Fig. 3)
- inversion techniques for tomography
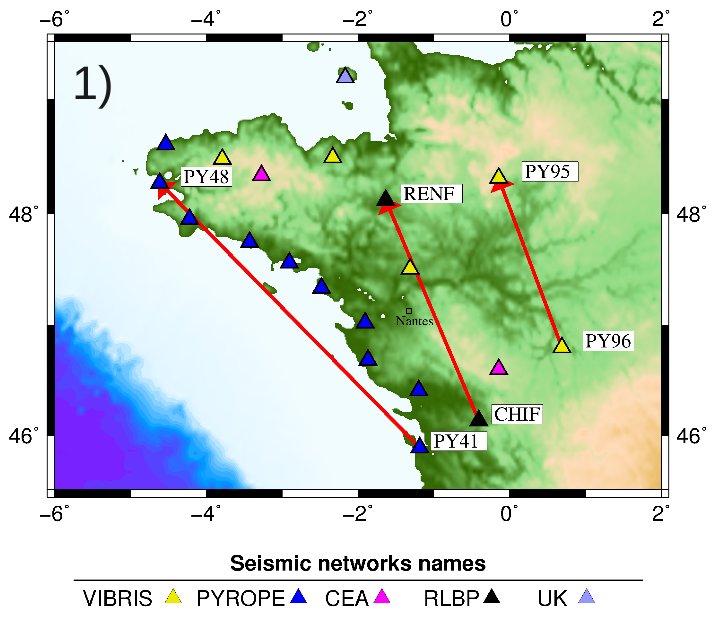
Figure 1: Regional array of broadband stations deployed on the Massif Armoricain. The red arrows indicate the pair of stations used to compute the noise correlation functions shown in Fig. 2. The direction of the arrows indicates the mean direction of the energy which contributes to the emergence of a signal in the positive times of the noise correlation functions shown in Fig. 2.
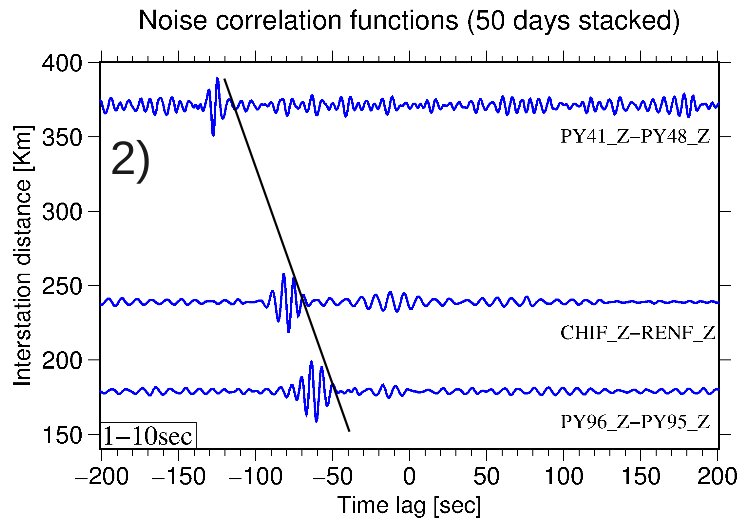
Figure 2: Example of noise correlation functions in function of the interstation distance. The pairs of stations used are shown in Fig. 1. All the noise correlations were obtained using 50 days of continuous record (autumn 2012) on the vertical component. The data were previously filtered between 1 and 10 seconds. No operation of whitening was done. The straight line indicates the presence of a wave which propagates at 2,9 km/s, in good consistency with a typical continental group velocity for a surface wave below 10s of period. The emergence of this consistent signal is only observed on negative times, showing an inhomogeneous distribution of noise sources at this season, mostly concentrated at the North-East of the stations.
Mis à jour le 23 March 2015.